Animal diseases in Switzerland
FSVO, Federal Food Safety and Veterinary Office, collects data on the animal diseases in Switzerland. This data is published as Linked Data.
In this tutorial, we will show how to work with Linked Data. Mainly, we will see how to work with data on animal disease.
We will look into how to query, process, and visualize it.
1. Setup
1.1 Python
1.2 SPARQL endpoints
1.3 SPARQL client
2. Data
2.1 Animal species
2.2 Diseases
2.3 Can we link disease to animal type?
2.4 Reports
2.5 Example: goats
3. Analysis
3.1 Cattle: Mucosal Disease
3.2 Bees: Sauerbrut
3.3 Rabies
3.4 Most common diseases
3.5 Reports over time
Setup
Python
This notebook requires Python 3.9 or later to run.
SPARQL endpoints
For epidemiological data
Reports on animal diseases are published as Linked Data. It can be accessed with SPARQL queries.
You can send queries using HTTP requests. The API endpoint is https://lindas.admin.ch/query/.
For geodata
Animal diseases are closely linked to places. To understand their location, we will work with Swiss geodata. It is published as Linked Data. It can be accessed using API endpoint under https://ld.geo.admin.ch/query.
import datetime
import itertools
import json
import folium
import mapclassify
import matplotlib as mpl
import matplotlib.cm
import networkx as nx
import pandas as pd
import plotly.express as px
import plotly.graph_objects as go
from bokeh.io import output_notebook, show
from bokeh.models import (Circle, CustomJS, HoverTool, LabelSet, MultiLine,
NodesAndLinkedEdges, Plot, TapTool)
from bokeh.palettes import Paired
from bokeh.plotting import ColumnDataSource, from_networkx
from dateutil.relativedelta import relativedelta
from folium.plugins import TimeSliderChoropleth
from graphly.api_client import SparqlClient
from plotly.subplots import make_subplots
from enum import Enum
from collections import namedtuple
# Uncomment to install dependencies in Colab environment
#!pip install mapclassify
#!pip install git+https://github.com/zazuko/graphly.git
sparql = SparqlClient("https://int.lindas.admin.ch/query")
geosparql = SparqlClient("https://ld.geo.admin.ch/query")
sparql.add_prefixes({
"schema": "<http://schema.org/>",
"cube": "<https://cube.link/>",
"admin": "<https://schema.ld.admin.ch/>",
"skos": "<http://www.w3.org/2004/02/skos/core#>",
"disease": "<https://agriculture.ld.admin.ch/foen/animal-pest/>"
})
geosparql.add_prefixes({
"dct": "<http://purl.org/dc/terms/>",
"geonames": "<http://www.geonames.org/ontology#>",
"schema": "<http://schema.org/>",
"geosparql": "<http://www.opengis.net/ont/geosparql#>",
})
SPARQL queries can become very long. To improve the readibility, we will work wih prefixes.
Using the add_prefixes method, we can define persistent prefixes.
Every time you send a query, graphly will now automatically add the prefixes for you.
Data
Our goal is to understand outbreaks of animal diseases. First, let's take a look at the animals found in our dataset.
Animal species
query = """
SELECT DISTINCT ?species ?group
WHERE {
?s disease:animal-specie ?speciesIRI.
?speciesIRI schema:name ?species.
?speciesIRI skos:broader/schema:name ?group.
FILTER (LANG(?species) = "de")
FILTER (LANG(?group) = "de")
}
ORDER BY ?group
"""
df = sparql.send_query(query)
df[0:15]
Diseases
Now, let's take a look at the diseases the animals can suffer from.
query = """
SELECT DISTINCT ?disease ?group
WHERE {
?s disease:epidemics ?diseaseIRI.
?diseaseIRI schema:name ?disease.
?diseaseIRI skos:broader/schema:name ?group.
FILTER (LANG(?disease) = "de")
FILTER (LANG(?group) = "de")
}
ORDER BY ?group
"""
df = sparql.send_query(query)
df.head()
Can we link disease to animal type?
Thus far, we have seen all animals, and all diseases. However, not all animals will catch all diseases.
What diseases are swiss animals exposed to?
query = """
SELECT DISTINCT ?disease ?species ?group
WHERE {
<https://agriculture.ld.admin.ch/foen/animal-pest/observation/> cube:observation ?obs .
?obs disease:epidemics/schema:name ?disease;
disease:animal-specie ?speciesIRI.
?speciesIRI schema:name ?species.
?speciesIRI skos:broader/schema:name ?group.
FILTER (LANG(?disease) = "de")
FILTER (LANG(?species) = "de")
FILTER (LANG(?group) = "de")
}
ORDER BY ?species
"""
df = sparql.send_query(query)
df = df[df.group != "Wildtier"]
# Graph of disease-species relations
graph = nx.from_pandas_edgelist(df, source='disease', target='species')
groups = {key: "disease" for key in df.disease} | {key: "species" for key in df.species}
nx.set_node_attributes(graph, groups, name="group")
colormaps = {"fill_color":
{"disease": Paired[4][0], "species": Paired[4][2]},
"hover_color":
{"disease": Paired[4][1], "species": Paired[4][3]}
}
for name, colormap in colormaps.items():
colors = {k: colormap[v] for k, v in groups.items()}
nx.set_node_attributes(graph, colors, name=name)
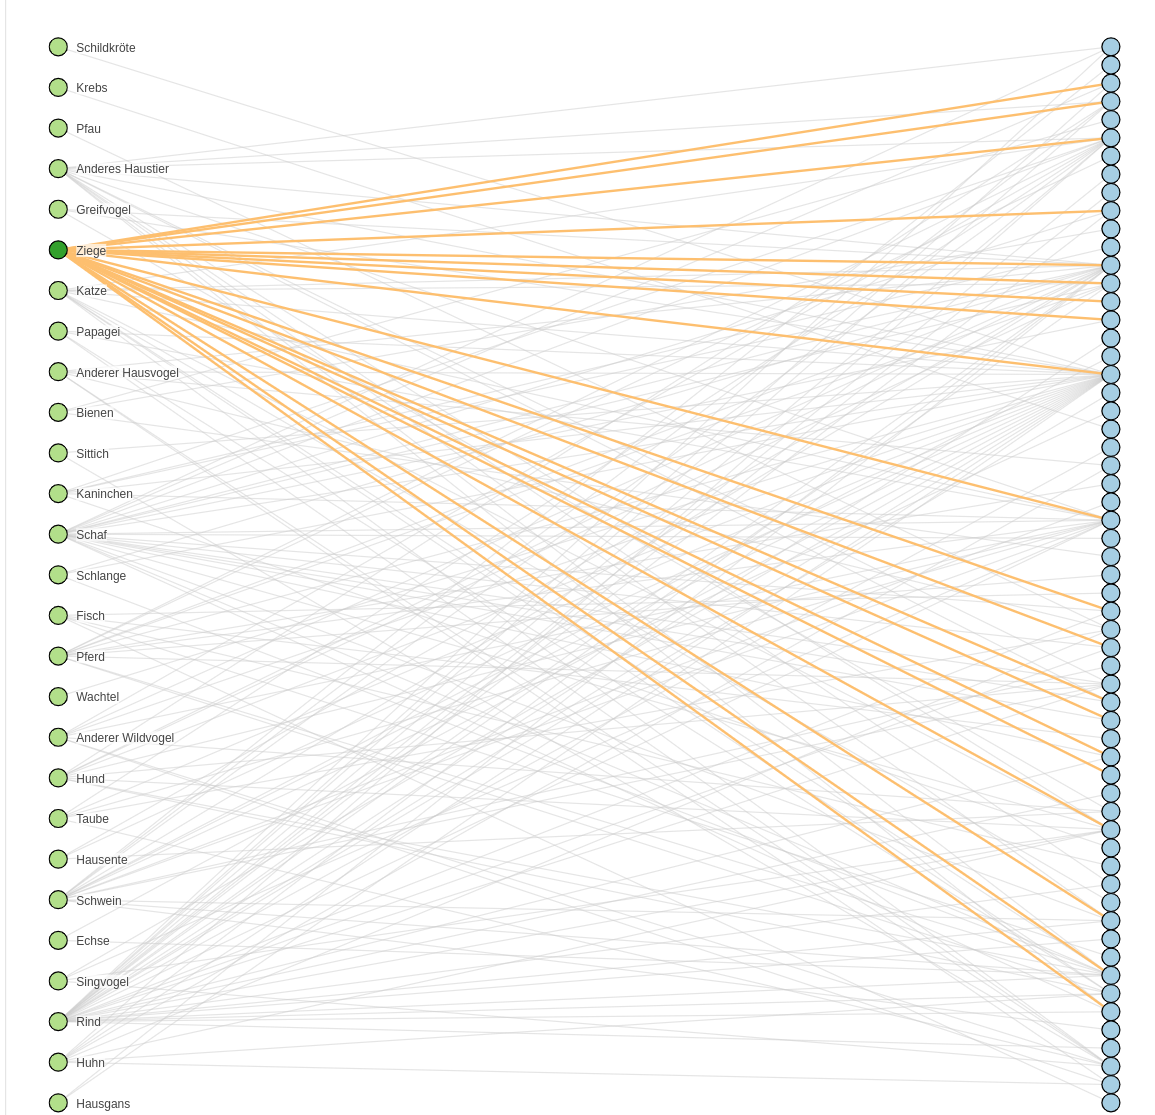
# Interactive graph plot
plot = Plot(plot_width = 1000, plot_height=1000)
plot.title.text = 'Swiss animals and their diseases'
graph_renderer = from_networkx(graph, nx.drawing.layout.bipartite_layout, nodes = df.species.unique())
# manipulating nodes
nonselect_node = Circle(size = 15, fill_color = "fill_color")
select_node = Circle(size = 15, fill_color = "hover_color")
graph_renderer.node_renderer.glyph = nonselect_node
graph_renderer.node_renderer.nonselection_glyph = nonselect_node
graph_renderer.node_renderer.selection_glyph = select_node
graph_renderer.node_renderer.hover_glyph = select_node
graph_renderer.node_renderer.data_source.data['group'] = [groups[g] for g in graph_renderer.node_renderer.data_source.data["index"]]
# manipulating edges
select_edge = MultiLine(line_color = Paired[7][-1], line_width = 2)
graph_renderer.edge_renderer.glyph = MultiLine(line_color = '#CCCCCC', line_alpha = .5, line_width = 1)
graph_renderer.edge_renderer.selection_glyph = select_edge
graph_renderer.edge_renderer.hover_glyph = select_edge
graph_renderer.selection_policy = NodesAndLinkedEdges()
graph_renderer.inspection_policy = NodesAndLinkedEdges()
plot.renderers.append(graph_renderer)
callback_code = '''
if (cb_data.index.indices.length > 0) {
const index = cb_data.index.indices[0];
if (source.data.group[index] === "species") {
hover.tooltips = [["Animal", "@index"]];
}
else {
hover.tooltips = [["Disease", "@index"]];
}
}
'''
hover = HoverTool(
renderers=[graph_renderer.node_renderer]
)
hover.callback = CustomJS(
args = dict(source = graph_renderer.node_renderer.data_source, hover = hover),
code = callback_code
)
pos = {k: v for k, v in graph_renderer.layout_provider.graph_layout.items() if graph.nodes[k]["group"] == "species"}
names = list(pos.keys())
x, y = map(list, zip(*pos.values()))
source = ColumnDataSource({'x': x, 'y': y, 'name': names})
labels = LabelSet(x_offset=15, y_offset=-6, x='x', y='y', text='name', source=source, background_fill_color='white', text_font_size='10px', background_fill_alpha=.7)
plot.renderers.append(labels)
plot.add_tools(hover, TapTool())
output_notebook()
show(plot)
Reports
When animals get sick, the farmer will typically consult a vet. After diagnosis, the incident is reported to the Federal Office for Agriculture. This data is publicly available and can be found in our endpoint:
#Run in browser: https://s.zazuko.com/24fSKE
query = """
SELECT ?diagnosis ?commune ?species ?stock ?sick ?infected ?killed ?deceased ?disease
WHERE {
<https://agriculture.ld.admin.ch/foen/animal-pest/observation/> cube:observation ?obs .
?obs disease:epidemics/schema:name ?disease;
disease:diagnosis-date ?diagnosis;
disease:animals-stock ?stock;
disease:animals-sick ?sick;
disease:animals-infected ?infected;
disease:animals-killed ?killed;
disease:animals-deceased ?deceased;
disease:internet-publication ?date;
disease:animal-specie/schema:name ?species;
schema:containedInPlace/schema:name ?commune .
FILTER (LANG(?disease) = "de")
FILTER (LANG(?species) = "de")
}
ORDER BY DESC(?diagnosis) ?commune
"""
df = sparql.send_query(query)
df.head()
Aggregated reports
The reports give us many details. It tells us not only what species was affected, but also how many animals got sick, infected, or deceased.
These reports, however, have one limitation. The analysis of a report of a single animal holding does not give insight into the disease situation of the whole population. Therefore it is necessary to look at all reports for that disease in a given time.
We will hence work with number of reports. Instead of looking at how individual farms were affected, we will simply count how many farms reported health issues.
Our core data becomes:
query = """
SELECT ?diagnosis ?municipality_id ?municipality ?species ?disease
WHERE {
<https://agriculture.ld.admin.ch/foen/animal-pest/observation/> cube:observation ?obs .
?obs disease:epidemics/schema:name ?disease;
disease:diagnosis-date ?diagnosis;
disease:internet-publication ?date;
disease:animal-specie/schema:name ?species;
schema:containedInPlace ?municipality_iri.
?municipality_iri schema:name ?municipality ;
schema:identifier ?municipality_id.
FILTER (LANG(?disease) = "de")
FILTER (LANG(?species) = "de")
}
ORDER BY DESC(?diagnosis) ?municipality
"""
df = sparql.send_query(query)
def aggregate_reports(reports: pd.DataFrame, weekly: bool) -> pd.DataFrame:
df = reports.copy()
if weekly:
df["diagnosis"] = df.diagnosis.apply(lambda x: datetime.date(x.year, 1, 1) + relativedelta(weeks=+x.isocalendar()[1]))
else:
df['diagnosis'] = df.diagnosis.apply(lambda x: datetime.date(x.year, x.month, 1))
return df[["diagnosis", "species", "disease", "municipality_id"]].groupby(by=["diagnosis", "species", "disease", "municipality_id"]).size().reset_index(name="reports")
# Aggregate results by week/month
df_monthly = aggregate_reports(df, False)
df_monthly = df_monthly[["diagnosis", "species", "disease"]].groupby(by=["diagnosis", "species", "disease"]).size().reset_index(name="reports")
df_monthly = df_monthly.sort_values(by=["diagnosis", "disease", "species"], ascending=False).reset_index(drop=True)
df_monthly.head()
Example: goats
We have seen that one animal can suffer from many diseases. Remember the animal-disease graph? A goat can get sick of twenty different diseases!
Goat diseases
Some of them occur more often than others. Which ones were the most often reported in the past?
DimensionData = namedtuple('Dimension', ['slice_of', "category"])
class Dimension(Enum):
Disease = DimensionData("disease", "species")
Species = DimensionData("species", "disease")
def plot_multiple_categories(df: pd.DataFrame, dim: Dimension, value: str, min_reports: int=15, min_reports_at_time:int = 5) -> None:
category = dim.value.category
df_slice = df[df[dim.value.slice_of] == value]
counts = df_slice[[category, "reports"]].groupby(category).agg(["sum", "max"]).reset_index()
categories_filtered = list(counts[(counts["reports"]["sum"] >= min_reports) & (counts["reports"]["max"] >= min_reports_at_time)][category])
df_slice = df_slice[df_slice[category].isin(categories_filtered)]
all_dates = [x.date() for x in pd.date_range(df_slice.diagnosis.min(), df_slice.diagnosis.max(), freq='MS')]
combinations = list(itertools.product(*[all_dates, df_slice[category].unique()]))
values_empty = pd.DataFrame(combinations, columns =['diagnosis', category])
plot_df = pd.merge(values_empty, df_slice, how="left", on=["diagnosis", category]).fillna(0)
fig = go.Figure()
for cat in plot_df[category].unique():
plot_df_slice = plot_df[plot_df[category] == cat]
labels = ["<b>{}</b><br>Date: {}<br>Reports: {}".format(cat, row.diagnosis, int(row.reports)) for row in plot_df_slice[["diagnosis", "reports"]].itertuples()]
fig.add_trace(go.Scatter(x=plot_df_slice.diagnosis, y=plot_df_slice.reports, name=cat,
text=labels,
hoverinfo='text',
line_shape='spline'))
fig.update_xaxes(rangeslider_visible=True, range=[min(plot_df.diagnosis), max(plot_df.diagnosis)])
fig.update_yaxes(title="reports", range = [0, int(max(plot_df.reports)*1.1)+1])
fig.update_layout(
title={"text": "Disease: {}".format(value), "x": 0.5}
)
fig.show()
plot_multiple_categories(df_monthly, Dimension.Species, "Ziege", 15, 5)
Analysis
Some diseases occur more often than others. What were the most reported diseases in the last years?
diseases = df_monthly[["reports", "disease"]].groupby("disease").sum().reset_index().sort_values(by="reports", ascending=False).reset_index(drop=True)
diseases[:15]
Cattle: Mucosal Disease
Bovine Virusdiarrhoe / Mucosal Disease has the highest number of reports. That is because the national eradication programme requires regular, repeated testings of every cattle herd per year.
Let's take a look at the number of reports over time.
We can see that Bovine Virusdiarrhoe has hight number of reports in 2008-2009. This was when the official control programme started (2008), involving hundreds and thousands of testings with the aim to find as many infected herds as possible. That explains so many positive findings. You can learn more about it here.
disease = "Bovine Virusdiarrhoe / Mucosal Disease"
plot_df = df_monthly[df_monthly.disease == disease]
fig = px.bar(plot_df, x="diagnosis", y="reports")
fig.update_layout(
title={"text": disease, "x": 0.5}
)
fig.show()
Bees: Sauerbrut
Sauerbrut der Bienen is the second most reported animal disease. Taking a look at the frequency of reports, explains why.
Sauerbrut is a seasonal disease. One can observe it first in early spring. Numbers peak around May, and tend to go down afterwards. While we cannot speak about one, big outbreak, sauerbrut is defnitely an issue for apiculturists.
disease = "Sauerbrut der Bienen"
plot_df = df_monthly[df_monthly.disease == disease]
fig = px.bar(plot_df, x="diagnosis", y="reports")
fig.update_xaxes(rangeslider_visible=True)
fig.update_layout(
title={"text": disease, "x": 0.5}
)
fig.show()
Bees: diseases
What about other bee diseases? Are they also seasonal?
plot_multiple_categories(df_monthly, Dimension.Species, "Bienen", 15, 2)
While Sauerbrut is clearly the biggest issue, it is not the only seasonal bees' disease . Faulbrut also shows seasonality pattern, with peak reports in springtime.
Rabies
Now, let's take a look at rabies.
A histogram tells a clear story: rabies is barely reported any more! Rabies was a serious issue until ~1995. But nowadays, almost no cases of rabies in Switzerland are reported.
disease = "Tollwut"
plot_df = df_monthly[df_monthly.disease == disease]
fig = px.bar(plot_df, x="diagnosis", y="reports")
fig.update_layout(
title={"text": disease, "x": 0.5}
)
fig.show()
Rabies: animals
What animals were main carriers of rabis?
plot_multiple_categories(df_monthly, Dimension.Disease, "Tollwut", 15, 2)
The graph shows how effective the oral vaccination of foxes for rabies has been in the middle of the nineties.
Most common diseases
Now, let's take a look at the most common diseases of the last years. What are the patterns? How many cases did we have? Are there any trends, or seasonalities?
ROWS=4
COLS=2
biggest_disease = diseases[0:ROWS*COLS]
fig = make_subplots(rows=ROWS, cols=COLS, subplot_titles=biggest_disease["disease"])
for obs in biggest_disease.itertuples():
row = obs.Index//COLS + 1
col = obs.Index%COLS + 1
plot_df = df_monthly[df_monthly.disease == obs.disease]
fig.append_trace(go.Scatter(x=plot_df["diagnosis"], y=plot_df["reports"], name=obs.disease, marker_color=px.colors.qualitative.Dark24[0], line_shape="spline"), row=row, col=col)
fig.update_layout(height=1200, width=1000, title={"text": "Biggest animal disease in Switzerland", "x": 0.5}, showlegend=False)
fig.show()
Reports over time
Bovine Virusdiarrhoe has a high number of reports in 2008-2009. This was when the official control programme started (2008), involving hundreds and thousands of testings with the aim to find as many infected herds as possible. The efforts put into testing and reporting this disease are a part of an eradication program ongoing since 2008. Can we see these efforts in the data?
Where were the first reports coming from? How did that evolve over time?
query = """
SELECT ?municipality_id ?municipality ?boundary
WHERE {
?muni_iri dct:hasVersion ?version ;
geonames:featureCode geonames:A.ADM3 .
?version schema:validUntil "2020-12-31"^^<http://www.w3.org/2001/XMLSchema#date>;
schema:name ?municipality;
geosparql:hasGeometry/geosparql:asWKT ?boundary.
BIND(IRI(REPLACE(STR(?muni_iri), "https://ld.geo.admin.ch/boundaries/", "https://ld.admin.ch/")) AS ?municipality_id)
}
"""
communes = geosparql.send_query(query)
communes = communes.set_crs(epsg=4326)
communes["municipality_id"] = communes.municipality_id.str.split("/").str[-1].astype(int)
communes = communes.set_index("municipality_id")
DISEASE = "Bovine Virusdiarrhoe / Mucosal Disease"
SPECIES = "Rind"
START = datetime.date(2008, 3, 1)
END = datetime.date(2009, 7, 1)
WINDOW = 6
df_weekly = aggregate_reports(df, True)
subset = df_weekly[(df_weekly.species == SPECIES) & (df_weekly.disease == DISEASE) & (df_weekly.diagnosis >= START) & (df_weekly.diagnosis <= END)].copy()
rolling_reports = subset[["diagnosis", "municipality_id", "reports"]].pivot(index="diagnosis", columns="municipality_id", values="reports").sort_index().fillna(0)
rolling_reports = rolling_reports.rolling(WINDOW).sum().iloc[WINDOW-1:,:]
datetime_index = pd.DatetimeIndex(rolling_reports.index)
dt_index_epochs = datetime_index.view("int") // 10**9
rolling_reports.index = dt_index_epochs.astype('U10')
bins = [1,2,5,8,25,rolling_reports.values.max()]
classifier = mapclassify.UserDefined(y=rolling_reports.values[rolling_reports.values > 0], bins=bins)
categories = range(len(bins))
colormap = {cat: mpl.colors.rgb2hex(mpl.cm.PuRd(i/(len(categories)-1))) for i, cat in enumerate(categories)}
styledict = {}
timestamps = rolling_reports.index
for commune in communes.index:
styledict[commune] = {str(t): {"color": colormap[0], "opacity": 1} for t in timestamps}
if commune in rolling_reports.columns:
for timestamp in timestamps:
reports = rolling_reports.loc[timestamp, commune]
reports_classified = classifier(reports)[0]
styledict[commune][str(timestamp)] = {"color": colormap[reports_classified], "opacity": 1}
communes["dummy"] = 0
m = folium.Map(location=[46.83, 8.13], zoom_start=8, tiles="cartodbpositron")
g = TimeSliderChoropleth(
communes.to_json(),
styledict=styledict
).add_to(m)
folium.Choropleth(
geo_data=json.loads(communes.to_json()),
data=communes,
columns=['municipality', 'dummy'],
key_on='feature.id',
fill_color= 'PuRd',
fill_opacity=0.0,
line_opacity=0.0,
bins=[0]+bins,
legend_name="Reports of {}".format(DISEASE)
).add_to(m)
folium.LayerControl().add_to(m)
m
Thank you for following along and hopefully this notebook was helpful. If you want to get in touch with us, please reach out to us via email.